
2016 US lymphoid malignancy statistics by World Health Organization subtypes
DISCLOSURES: Christopher R. Flowers reports consulting fees from Spectrum, Celgene, Optum Rx, and Seattle Genetics; unpaid consultancy work for Genentech/Biogen-Idec/Roche and Millennium/Takeda; institutional research funding/grants from Abbvie, Acerta, Celgene, Gilead Sciences, Infinity Pharmaceuticals, Millennium/Takeda, Spectrum, Onyx Pharmaceuticals, the National Cancer Institute/National Institutes of Health, the Borroughs Wellcome Fund, and The V Foundation; and personal fees for developing educational presentations from Clinical Care Options, Educational Concepts, PRIME Oncology, and Research to Practice, all outside the submitted work. All remaining authors report no conflicts of interest.
ABSTRACT
Collectively, lymphoid neoplasms are the fourth most common cancer and the sixth leading cause of cancer death in the United States. The authors provide contemporary lymphoid neoplasm statistics by subtype based on the 2008 World Health Organization classifications, including the most current US incidence and survival data. Presented for the first time are estimates of the total numbers of US lymphoid neoplasm cases by subtype as well as a detailed evaluation of incidence and survival statistics. In 2016, 136,960 new lymphoid neoplasms are expected. Overall lymphoma incidence rates have declined in recent years, but trends vary by subtype. Precursor lymphoid neoplasm incidence rates increased from 2001 to 2012, particularly for B-cell neoplasms. Among the mature lymphoid neoplasms, the fastest increase was for plasma cell neoplasms. Rates also increased for mantle cell lymphoma (males), marginal zone lymphoma, hairy cell leukemia, and mycosis fungoides. Like incidence, survival for both mature T-cell lymphomas and mature B-cell lymphomas varied by subtype and by race. Patients with peripheral T-cell lymphomas had among the worst 5-year relative survival (36%-56%, depending on race/sex), while those with mycosis fungoides had among the best survival (79%-92%). For B-cell lymphomas, 5-year survival ranged from 83% to 91% for patients with marginal zone lymphoma and from 78% to 92% for those with hairy cell leukemia; but the rates were as low as 47% to 63% for patients with Burkitt lymphoma and 44% to 48% for those with plasma cell neoplasms. In general, black men had the lowest survival across lymphoid malignancy subtypes. These contemporary incidence and survival statistics are useful for developing management strategies for these cancers and can offer clues regarding their etiology. CA Cancer J Clin 2016;66:443–459. © 2016 American Cancer Society.
Introduction
Historical reporting of hematologic malignancy statistics grouped them into 5 major categories: Hodgkin lymphoma, non-Hodgkin lymphoma (NHL), myeloma, and acute and chronic leukemias. However, biologic, diagnostic, and therapeutic advances in hematologic malignancies have brought about many changes in how these cancers are classified, diagnosed, and treated.1-3 As a result, these historical groupings reflect neither current understanding of pathogenesis nor current clinical practice. While maintaining the original groupings can be useful for historical comparisons, there is a clear need for contemporary statistics that reflect the current state of knowledge about these diseases.
Contemporary, comprehensive, population-based information about the underlying patterns of incidence and survival of clinically meaningful subtypes of lymphoid malignancies in the United States remains limited. Previous articles reported on either incidence or survival statistics for specific age or race groups, earlier time periods, for all NHL combined, or for a few specific lymphoid neoplasm subtypes.4-9 A recent report from the United Kingdom10 provided an updated overview of national lymphoid malignancy incidence, survival, and prevalence statistics for that country; but an updated, comprehensive review for the United States has not been done. Two US-based articles11, 12 presented US lymphoma incidence patterns by World Health Organization (WHO) subtype using Surveillance, Epidemiology, and End Results (SEER) data but did not include survival data. A report from the National Cancer Data Base described 5-year survival for WHO subtypes, but this was not in a population-based sample.13
In this article, we augment the existing literature by presenting estimated counts of new lymphoid neoplasm cases by WHO subtype for 2016 as well as updating lymphoid neoplasm incidence rates using US data that are more comprehensive than those used in previous publications. We examine these rates overall and by age, race, and sex where sample size allows. In addition, we present the most comprehensive and updated US survival statistics for lymphoid neoplasms by race and sex.
Methods
Study Data
Incidence
Incidence data from 1995 onward were compiled by the North American Association of Central Cancer Registries (NAACCR) from cancer registries that participate in the Centers for Disease Control and Prevention National Program of Cancer Registries or the SEER program. For this analysis, we used incidence data from 45 US states and the District of Columbia, representing 95% of the US population, to provide incidence rates during 2011 through 2012 by lymphoma subtype, sex, race/ethnicity, and age at diagnosis (in 5-year age groups).14 Data from Arkansas, Kansas, Minnesota, Nevada, and Vermont were not included, because those states did not submit data, failed to meet NAACCR high-quality standards for 1 or more years during 2011 through 2012, or did not consent to participate in this study. We analyzed trends in incidence rates from 2001 through 2012, because 2001 was the beginning of a new era in lymphoid neoplasm classification with the publication of the WHO classification system.15 For analyses of incidence trends, we excluded 4 additional states (Mississippi, New Hampshire, Tennessee, and Virginia) and the District of Columbia, because data were not available for 1 or more years during 2001 through 2012. Trend analyses were also limited to first primary diagnoses (in contrast to rates, rate ratios, and estimated new cases that included all cases). Patients who were reported only from a nursing home/convalescent center, autopsy, or death certificate were excluded.
Survival
Data from the 18 SEER registries (Atlanta, Connecticut, Detroit, Hawaii, Iowa, New Mexico, San Francisco-Oakland, Seattle-Puget Sound, Utah, Los Angeles, San Jose-Monterey, Rural Georgia, Alaska Native Tumor Registry, Greater California, Kentucky, Louisiana, New Jersey, and Greater Georgia), covering approximately 28% of the US population, were used to provide estimates of relative survival for major subtypes.16 Relative survival was calculated using nationwide population life tables stratified by age, sex, calendar time, and, where applicable, race. Two-year relative survival rates were based on patients who were diagnosed during 2007 to 2011, 5-year survival rates were based on diagnoses from 2005 to 2011, and 10-year survival rates were based on diagnoses from 2001 to 2011; all patients were followed through 2012.
Lymphoid neoplasm subtypes
Lymphoid malignancy subtypes were defined using the 2008 WHO classification scheme.17 The WHO classification system is currently considered the “gold standard” for classifying all hematopoietic neoplasms.15 That classification scheme takes into account many aspects of the disease, including morphology, immunophenotype, and cytogenetic and molecular characteristics. Although some updates have been made, and a new WHO manual was released in 2016,18, 19 the available surveillance data are through 2012 and do not reflect these updates. The new entities have not yet been captured by the registries, and the ability to recode existing data to these new descriptors will be limited because many require additional molecular or clinical data. Thus, the frequency of these new entities will be unclear until they become adopted by hematopathologists and routinely distinguished in clinical practice. However, these changes to the 2008 classification are relatively small and would not be expected to change our conclusions. The WHO classification has been adopted worldwide, and the terminology is incorporated into the third edition of the International Classification of Diseases for Oncology (ICD-O).20 ICD-O codes for each subtype are listed in Table 1.
| SUBTYPE† | ICD-O-3 CODES | INCIDENCE RATE*, 2011-2012 | ESTIMATED NEW CASES, 2016 | |||||
|---|---|---|---|---|---|---|---|---|
| Lymphoid neoplasms, total | 34.4 | 136,960 | ||||||
| 1 Hodgkin lymphoma | 2.7 | 8,500 | ||||||
| 1(a) Classical Hodgkin lymphoma | 2.5 | 7,950 | ||||||
| 1(a) 1. Classical Hodgkin lymphoma, lymphocyte rich | 9651 | 0.1 | 320 | |||||
| 1(a) 2. Classical Hodgkin lymphoma, nodular sclerosis | 9663-9667 | 1.4 | 4,280 | |||||
| 1(a) 3. Mixed cellularity/lymphocyte depleted | 9652-9655 | 0.3 | 1,060 | |||||
| 1(a) 4. Classical Hodgkin lymphoma, NOS | 9650,9661-9662 | 0.7 | 2,290 | |||||
| 1(b) Nodular lymphocyte predominant Hodgkin lymphoma | 9659 | 0.2 | 550 | |||||
| 2 Non-Hodgkin lymphoid neoplasms‡ | 31.1 | 125,850 | ||||||
| 2(a) Non-Hodgkin lymphoid neoplasms, B-cell | 29.0 | 117,470 | ||||||
| 2(a) 1. Precursor B-cell lymphoblastic leukemia/lymphoma | 1.4 | 4,930 | ||||||
| 2(a) 1.1. Precursor B-cell lymphoblastic leukemia/lymphoma, NOS | 9727(B), 9728, 9811, 9835(B), 9836 | 1.3 | 4,570 | |||||
| 2(a) 1.2. Precursor B-cell lymphoblastic leukemia/lymphoma, with recurrent genetic abnormalities | 9812-9818 | 0.1 | 360 | |||||
| 2(a) 2. Mature Non-Hodgkin lymphoma, B-cell | 25.8 | 105,190 | ||||||
| 2(a) 2.1. Chronic/Small/Prolymphocytic/Mantle B-cell non-Hodgkin lymphoma | 5.9 | 24,420 | ||||||
| 2(a) 2.1.1. Chronic lymphocytic leukemia/small lymphocytic lymphoma | 9670, 9823 | 5.1 | 20,980 | |||||
| 2(a) 2.1.2. Prolymphocytic leukemia, B-cell | 9832(B), 9833 | <0.1 | 120 | |||||
| 2(a) 2.1.3. Mantle cell lymphoma | 9673 | 0.8 | 3,320 | |||||
| 2(a) 2.2. Lymphoplasmacytic lymphoma, including Waldenstrom macroglobulinemia | 9671, 9761 | 0.6 | 2,330 | |||||
| 2(a) 2.2.1. Lymphoplasmacytic lymphoma | 9671 | 0.3 | 1,060 | |||||
| 2(a) 2.2.2. Waldenstrom macroglobulinemia | 9761 | 0.3 | 1,270 | |||||
| 2(a) 2.3. Diffuse large B-cell lymphoma | 6.9 | 27,650 | ||||||
| 2(a) 2.3.1. Diffuse large B-cell lymphoma, NOS | 9684(B), 9680 (excluding C44.0-44.9, C49.9, C71.0-71.9) | 6.3 | 25,380 | |||||
| 2(a) 2.3.2. Primary DLBCL of the CNS | 9680 (C71.0-71.9) | 0.3 | 1,100 | |||||
| 2(a) 2.3.3. Primary cutaneous DLBCL, leg type | 9680 (C44.0-44.9) | 0.1 | 400 | |||||
| 2(a) 2.3.4. T-cell/histiocycte rich large B-cell lymphoma | 9688 | 0.1 | 200 | |||||
| 2(a) 2.3.5. Intravascular large B-cell lymphoma | 9712, 9680 (C49.9) | <0.1 | 60 | |||||
| 2(a) 2.3.6. ALK positive large B-cell lymphoma | 9737 | <0.1 | § | |||||
| 2(a) 2.3.7. Plasmablastic lymphoma | 9735 | <0.1 | 180 | |||||
| 2(a) 2.3.8. Large B-cell (plasmablastic) lymphoma arising from HHV-8 associated multicentric Castleman disease | 9738 | <0.1 | § | |||||
| 2(a) 2.3.9. Primary effusion lymphoma | 9678 | <0.1 | § | |||||
| 2(a) 2.3.10. Primary mediastinal (thymic) large B-cell lymphoma | 9679 | 0.1 | 240 | |||||
| 2(a) 2.4. Burkitt lymphoma/leukemia | 9687, 9826 | 0.4 | 1,480 | |||||
| 2(a) 2.5. Marginal zone lymphoma | 1.8 | 7,460 | ||||||
| 2(a) 2.5.1. Splenic marginal zone lymphoma | 9689 | 0.2 | 640 | |||||
| 2(a) 2.5.2. Extranodal marginal zone lymphoma | 9699 (excluding C77.0-77.9) | 1.1 | 4,450 | |||||
| 2(a) 2.5.3. Nodal marginal zone lymphoma | 9699 (C77.0-77.9) | 0.6 | 2,370 | |||||
| 2(a) 2.6. Follicular lymphoma | 3.4 | 13,960 | ||||||
| 2(a) 2.6.1. Primary cutaneous follicle center lymphoma | 9597, 9690 (C44.0-44.9) | 0.1 | 430 | |||||
| 2(a) 2.6.2 Follicular lymphoma NOS | 9691, 9695, 9698 | 3.3 | 13,530 | |||||
| 2(a) 2.7. Hairy cell leukemia | 9940 | 0.3 | 1,100 | |||||
| 2(a) 2.8. Hairy cell leukemia variant | 9591 (C42.1-42.2) | 0.2 | 810 | |||||
| 2(a) 2.9. Plasma cell neoplasms | 6.3 | 25,980 | ||||||
| 2(a) 2.9.1. Solitary plasmacytoma of bone | 9731 | 0.3 | 1,250 | |||||
| 2(a) 2.9.2. Extraosseous plasmacytoma | 9734 | 0.1 | 450 | |||||
| 2(a) 2.9.3. Plasma cell myeloma/leukemia | 9732-9733 | 5.9 | 24,280 | |||||
| 2(a) 2.10. Heavy chain diseases | 9762 | <0.1 | a | |||||
| 2(a) 3. B-cell lymphoid neoplasms, NOS | 9590(B), 9591(B) (excluding C42.1-42.2), 9675(B), 9820(B) | 1.8 | 7,350 | |||||
| 2(b) Non-Hodgkin lymphoid neoplasms, T/NK-cell | 2.1 | 8,380 | ||||||
| 2(b) 1. Precursor T/NK-cell lymphoblastic leukemia/lymphoma, NOS | 9727(T, NK), 9729, 9835(T, NK), 9837 | 0.3 | 1,070 | |||||
| 2(b) 2. Mature Non-Hodgkin lymphooid neoplasms, T/NK-cell | 1.8 | 7,190 | ||||||
| 2(b) 2.1. Mycosis fungoides/Sezary syndrome | 0.4 | 1,690 | ||||||
| 2(b) 2.1.1. Mycosis fungoides | 9700 | 0.4 | 1,620 | |||||
| 2(b) 2.1.2. Sezary syndrome | 9701 | <0.1 | 70 | |||||
| 2(b) 2.2. Peripheral T/NK-cell lymphoma | 1.0 | 3,950 | ||||||
| 2(b) 2.2.1. Peripheral T/NK-cell lymphoma, NOS | 9675(T, NK), 9702 | 0.4 | 1,660 | |||||
| 2(b) 2.2.2. Angioimmunoblastic T/NK-cell lymphoma | 9705 | 0.1 | 530 | |||||
| 2(b) 2.2.3. Subcutaneous panniculitis-like T-cell lymphoma | 9708 | <0.1 | a | |||||
| 2(b) 2.2.4. Anaplastic large cell lymphoma ALK-positive | 9714 | 0.2 | 830 | |||||
| 2(b) 2.2.5. Hepatosplenic T-cell lymphoma | 9716 | <0.1 | a | |||||
| 2(b) 2.2.6. Enteropathy-associated T-cell lymphoma | 9717 | <0.1 | 50 | |||||
| 2(b) 2.2.7. Primary cutaneous gamma-delta T-cell lymphoma | 9726 | <0.1 | a | |||||
| 2(b) 2.2.8. Primary cutaneous T-cell lymphoma, NOS | 9709 | 0.2 | 760 | |||||
| 2(b) 2.2.9. Systemic EBV-positive lymphoproliferative disease | 9724 | <0.1 | a | |||||
| 2(b) 2.3. Adult T-cell leukemia/lymphoma | 9827 | <0.1 | 180 | |||||
| 2(b) 2.4. Extranodal NK/T-cell lymphoma, nasal type | 9719 | 0.1 | 190 | |||||
| 2(b) 2.5. T-cell large granular lymphocytic leukemia (T-LGL) | 9831 | 0.2 | 670 | |||||
| 2(b) 2.6. T-cell prolymphocytic leukemia (T-PLL) | 9832(T, NK), 9834 | <0.1 | 160 | |||||
| 2(b) 2.7. Agressive NK-cell leukemia | 9948 | <0.1 | a | |||||
| 2(b) 2.8. Primary cutaneous CD30 + lymphoproliferative disorders | 9718 | 0.1 | 310 | |||||
| 2(b) 3. T/NK-cell, lymphoid neoplasms, NOS | 9590-9591(T, NK), 9684(T, NK), 9820(T, NK), 9970(T, NK) | <0.1 | 120 | |||||
| 3 B-cell lymphoma unclassifiable, with features intermediate between DLBCL and classical Hodgkin lymphoma | 9596 | <0.1 | 170 | |||||
| 4 Lymphoid neoplasm, NOS | 9590, 9727, 9820, 9835 (excluding B, T, NK) | 0.6 | 2,440 | |||||
- CNS indicates central nervous system; DLBCL, diffuse large B-cell lymphoma; EBV, Epstein-Barr virus; NK, natural killer cell; NOS, not otherwise specified; T, T cell.
- *Rates are per 100,000 and age adjusted to the US standard population.
- †Subtypes were defined using the World Health Organization (WHO) Classification of Tumours of Haematopoietic and Lymphoid Tissues17 and organized according to the Surveillance, Epidemiology, and End Results (SEER) Cancer Statistics Review (CSR), 1975-2012.60
- ‡Non-Hodgkin lymphoid neoplasms are defined here as any B-cell or T/NK-cell neoplasm other than Hodgkin lymphomas.
- §The estimate is fewer than 50 cases.
- Source: North American Association of Central Cancer Registries, Cancer in North America (CiNA) analytic file.14
Statistical Analyses
All incidence rates were age-standardized to the 2000 US standard population and expressed per 100,000 people, as calculated using the National Cancer Institute's SEER*Stat software package (version 8.2.1; National Cancer Institute, Bethesda, MD).21 We examined trends in lymphoid neoplasm incidence rates from 2001 to 2012 by subtype and sex using Joinpoint software (version 4.2.0.2; National Cancer Institute). This method involves fitting a series of joined straight lines on a logarithmic scale to the trends in annual rates with each junction or “joinpoint” denoting a statistically significant change in trend.22 The direction and magnitude of the resulting trends over the 2001 to 2012 period are described as the annual percent change (APC). If the program detects no change in trend for a given subtype between 2001 and 2012, then only a single APC will be given. If the program detects multiple trends, then the magnitude, direction, and years that the trend held constant will be listed separately. In describing trends, the terms increase and decrease were used when the APC was statistically significant; otherwise, the term stable was used. Incidence rate trends were adjusted for delays in reporting to account for the additional time required for registration of some cases. Delay adjustment has the largest effect on the most recent years of data for cancers that are frequently diagnosed in outpatient settings and provides a more accurate portrayal of the cancer burden in the most recent time period.23 Sex-specific and site-specific (Hodgkin lymphoma, NHL, and myeloma) delay-adjustment ratios from the SEER 18 areas were applied to the NAACCR data by year of diagnosis.24
Projected New Cases in 2016
The most recent year for which incidence data are available lags 2 to 4 years behind the current year because of the time required for data collection, compilation, quality control, and dissemination. Therefore, the American Cancer Society projects the numbers of new cancer cases in the United States in the current year to provide an estimate of the contemporary cancer burden for a number of cancer sites.25 These estimates were produced using a 3-step spatiotemporal model based on high-quality incidence data from 49 states and the District of Columbia, representing approximately 94% population coverage (data were lacking for all years for Minnesota and for some years for other states). Further details about the case projection methodology are described in detail elsewhere.26
In this report, we estimate the total number of lymphoid malignancies expected to occur in the United States in 2016 by summing previously published new case estimates of Hodgkin lymphoma, NHL, myeloma, acute lymphocytic leukemia, and chronic lymphocytic leukemia.25 Estimated cases for each lymphoid neoplasm subtype were then calculated by applying the proportion of cases of each subtype diagnosed during 2011 through 2012 from the NAACCR data to the overall 2016 lymphoid neoplasm estimate for the United States.
Selected Findings
Estimated Cases in 2016
In 2016, 136,960 lymphoid neoplasms are expected to be newly diagnosed in the United States (Table 1). Hodgkin lymphomas make up 6% of the total, and most are classical Hodgkin lymphoma. Of the 4 classical Hodgkin lymphoma subtypes, nodular sclerosis classical Hodgkin lymphoma is the most common (n = 4280 cases expected); followed by classical Hodgkin lymphoma, not otherwise specified (NOS) (n = 2290); and mixed-cellularity/lymphocyte-depleted classical Hodgkin lymphoma (n = 1060). Among NHL neoplasms (n = 125,850), defined here as any B-cell or T-cell/natural killer (NK)-cell neoplasm other than Hodgkin lymphoma, diffuse large B-cell lymphoma (DLBCL, n = 27,650) is the most common subtype. DLBCL comprises about one-quarter of the total mature NHL neoplasms (Fig. 1). Although there are 9 specified types of diffuse large B-cell lymphoma in the 2008 WHO classification scheme, most diffuse large B-cell lymphomas are still classified as diffuse large B-cell lymphoma NOS (n = 25,380). The most common type of specified diffuse large B-cell lymphoma is primary diffuse large B-cell lymphoma of the central nervous system (n = 1100); followed by primary cutaneous diffuse large B-cell lymphoma, leg type (n = 400); and primary mediastinal (thymic) large B-cell lymphoma (n = 240). Plasma cell neoplasms are primarily multiple myeloma (93%), but 1250 (5%) are expected to be solitary plasmacytoma of bone, and 450 (2%) are expected to be extraosseous plasmacytoma. Other major B-cell neoplasm subtypes include chronic lymphocytic leukemia/small lymphocytic lymphoma (n = 20,980), follicular lymphoma (n = 13,960), and marginal zone lymphoma (n = 7460). Among marginal zone lymphomas, 60% are extranodal (n = 4450), 32% are nodal (n = 2370), and 9% are splenic (n = 640). Rarer B-cell subtypes include hairy cell leukemia (n = 1100) and hairy cell leukemia variant (n = 810) as well as the extremely rare heavy-chain diseases. About one-half (55%) of the mature T-cell lymphomas are peripheral T-cell lymphomas (n = 3950).

Estimated Cases and Distribution of Mature Non-Hodgkin Lymphoid Neoplasm Subtypes: United States, 2016.
CLL/SLL indicates chronic lymphocytic leukemia/small lymphocytic lymphoma; DLBCL, diffuse large B-cell lymphoma; NHL, non-Hodgkin lymphoma.
*Includes Waldenstrom macrolobulinemia.†Includes Hairy cell leukemia variant.
Differences in Age, Sex, and Race by Lymphoma Subtype
Age
As with most cancers, lymphoid neoplasms are more common in older individuals. Just over one-half (54%) of all lymphoid neoplasms are diagnosed in individuals aged 65 years and older, but age distribution varies by subtype. For example, the majority (71%) of lymphoplasmacytic lymphomas/Waldenstrom macroglobulinemia diagnoses occur in individuals aged ≥65 years, but only 18% of Hodgkin lymphomas do. Unlike many other types of cancer, lymphoid neoplasms are also among the most common childhood cancers. Approximately two-thirds of childhood cancers are lymphoid neoplasms.27
Age-specific incidence rates for the major lymphoid neoplasm subtypes are displayed in Figure 2. Figure 2a shows that the bimodal age distribution often described for Hodgkin lymphoma is largely driven by subtype differences, with nodular sclerosis classical Hodgkin lymphoma the most common type before age 55 years and classical Hodgkin lymphoma NOS the more common subtype among older adults (ages 70 years and older). Classical Hodgkin lymphoma is more likely than nodular lymphocyte-predominant Hodgkin lymphoma to be associated with Epstein-Barr virus (EBV).28 Therefore, it is no surprise that the age incidence pattern previously reported for EBV-associated lymphomas29—a small peak in incidence in adolescents/young adults and a second, larger peak in older adults—is observed for 2 subtypes of classical Hodgkin lymphoma (NOS and mixed-cellularity classical Hodgkin lymphoma) (see Fig. 2a).

Age-Specific Incidence Rates for Select Lymphoid Neoplasm Subtypes: United States, 2011 to 2012.
CLL/SLL indicates chronic lymphocytic leukemia/small lymphocytic lymphoma; NOS, not otherwise specified.*Includes Waldenstrom macroglobulinemia.†Includes Hairy cell leukemia variant.Note: Rates not shown if based on fewer than 25 cases.Source: North American Association of Central Cancer Registries, Cancer in North America (CiNA) analytic file.14
Age-specific incidence rates for precursor lymphoid neoplasms are illustrated in Figure 2b. Precursor B-cell lymphoblastic leukemias/lymphomas are the most common lymphoid neoplasms diagnosed among children ages 0 to 14 years, although there is a second, smaller incidence peak between ages 50 and 70 years (Fig. 2b). Precursor T-cell lymphomas are found almost exclusively in children.
In contrast to cancers in adults, a relatively small proportion of childhood cancers have known preventable causes; but some nongenetic risk factors have been identified, particularly for hematologic malignancies.27, 29-31 There is evidence that childhood acute lymphocytic leukemia may arise from genetic or in utero exposures.27 Down syndrome is a strong risk factor for acute lymphocytic leukemia, and other genetic disorders are associated with this cancer as well. In addition to genetic susceptibility, high birth weight and childhood immune response may contribute to the risk of acute lymphocytic leukemia.32 Genetic susceptibility may also play a role in adult acute lymphocytic leukemia,33, 34 but other nongenetic factors have been suggested for adult acute lymphocytic leukemia as well, such as obesity35 and occupational exposures like working in the leather or textile industries.32
Figure 2c shows age incidence curves for the mature B-cell lymphoid neoplasms. Diagnoses of plasma cell neoplasms and chronic lymphocytic leukemia/small lymphocytic lymphoma rarely occur before age 45 years, and the rates increase rapidly until age 70 years, with a slightly steeper slope for plasma cell neoplasms than for chronic lymphocytic leukemia/small lymphocytic lymphoma. Chronic lymphocytic leukemia/small lymphocytic lymphoma is interesting, because there is strong evidence for a heritable component36-38 despite the finding that the incidence does not pick up until older ages. It may be that a combination of both genetic and nongenetic factors confers the strongest risk for this cancer, because several nongenetic factors (such as chemical exposures like Agent Orange, an herbicide used during the Vietnam War39) have also been associated with an increased risk of this cancer.40 As with many hematologic cancers, the etiology of plasma cell neoplasms remains poorly understood. However, some occupational, chemical, and energy balance exposures among adults have been suggested, and these factors may help explain the predominance of incidence in older individuals.41, 42
Diffuse large B-cell lymphoma is much more common in adults than children; rates increase dramatically by age 50 years (Fig. 2c). Research supports a multifactorial and complex etiology for these cancers,43, 44 and risk factors may be different for children and adults. Suspected risk factors for adult diffuse large B-cell lymphoma include B-cell–activating autoimmune diseases, hepatitis C virus seropositivity, farming, and higher young-adult body mass index. Less is known about risk factors for pediatric diffuse large B-cell lymphomas, but insights into the biology of these cancers suggest that they are more molecularly heterogeneous than adult diffuse large B-cell lymphomas.45
Although Burkitt lymphoma is relatively rare in the United States, it is one of the most common types of childhood lymphoma, particularly among boys. It has a bimodal distribution age distribution with a second peak in older adulthood. Sporadic Burkitt lymphoma, the type most commonly found in the United States, is not well understood. A European registry study from the Netherlands found differences in tumor characteristics between children and adult patients with Burkitt lymphoma, suggesting heterogeneity between childhood and adult Burkitt lymphoma.46
Both follicular lymphoma and marginal zone lymphoma increase in incidence from about age 30 to age 70 years. Interestingly, these are both subtypes in which there is not a male dominance in rates, unlike most types of lymphoid neoplasms. Risk factors for both subtypes include autoimmune conditions like Sjogren syndrome, which has a similar age of onset (ages 40-60 years) and is diagnosed primarily in women. Other suspected risk factors for follicular lymphoma include cigarette smoke (in women) and environmental exposures, such as benzene or solvents.47 Other than autoimmune disorders, the only putative risk factors for marginal zone lymphoma are infectious (eg, Helicobacter pylori) or environmental/chemical (eg, hair dye among women).48
Age incidence patterns of mature T-cell lymphomas are illustrated in Figure 2d. Diagnoses of mycosis fungoides begin in adolescence and peak by age 60 years, whereas peripheral T-cell lymphomas are diagnosed as early as childhood, and rates continue to increase until about age 70 years. Different risk factor patterns may explain these differences. Peripheral T-cell lymphoma may be more strongly related to immune perturbation,3 while mycosis fungoides may be more strongly associated with lifestyle factors, such as body size.49
Sex
Incidence rates and rate ratios (IRRs) by sex and race/ethnicity for selected lymphoma subtypes are described in Table 2. During 2011 and 2012, the overall incidence rates of lymphoid neoplasms were 51% higher in males than in females, and most subtypes showed excess risk for males, with the greatest excess risk observed for mantle cell lymphoma (IRR, 3.07), Burkitt lymphoma (IRR, 2.79), and hairy cell leukemia (IRR, 2.77). Reasons for higher rates in males for these subtypes are unclear, but occupational exposures, such as farm work and industrial or engineering work, may play a role in sex differences.50, 51 For Burkitt lymphoma, human immunodeficiency virus/acquired immunodeficiency syndrome (HIV/AIDS) may also play a role in the sex disparity in rates, because HIV/AIDS is a strong risk factor for immunodeficiency-associated Burkitt lymphoma, and HIV/AIDS rates are more than 4 times higher in males than in females.52 Other factors also must contribute to the sex disparity, because Burkitt lymphoma is more common in young boys than in girls.53 Only a few NHL subtypes show little sex differences, most prominently marginal zone lymphomas (IRR, 1.05) and follicular lymphomas (IRR, 1.18). It may be that some risk factors for marginal zone lymphoma and follicular lymphoma are specific to (or stronger in) women and, thus, rates among women for these lymphoid neoplasm subtypes are higher than the rates for other lymphoid neoplasm subtypes (and more similar to the rates among men). For example, autoimmune disease, particularly B-cell–activating autoimmune disease, is a stronger risk factor for marginal zone lymphoma than for other lymphoid neoplasms,3, 48 and these conditions are more common in women than in men.54 Interestingly, although there was no difference by sex in the rates of nodular sclerosis classical Hodgkin lymphoma, mixed cellularity classical Hodgkin lymphoma was twice as common in males. Mixed cellularity classical Hodgkin lymphoma, like Burkitt lymphoma, is commonly associated with EBV,29 and this might help explain this difference, because studies of Hodgkin lymphoma tumors produced evidence that EBV was twice as common in tumors from men compared with women.29 Further research into the biologic and etiologic explanations for all of these differences by subtype is needed.
| ALL RACES | NON-HISPANIC/WHITE (W) | NON-HISPANIC/BLACK (B) | HISPANIC/ALL RACES (H) | ASIAN/PACIFIC ISLANDER (API) | ||||||||||||||
|---|---|---|---|---|---|---|---|---|---|---|---|---|---|---|---|---|---|---|
| MALE (M) | FEMALE (F) | IRR M:F | MALE | FEMALE | ALL | MALE | FEMALE | ALL | IRR B: W | MALE | FEMALE | ALL | IRR H: W | MALE | FEMALE | ALL | IRR API: W | |
| Lymphoid neoplasms, total | 42.2 | 28.1 | 1.51† | 43.4 | 28.3 | 35.1 | 40.5 | 29.1 | 33.9 | 0.96† | 35.6 | 25.7 | 30.1 | 0.86† | 25.3 | 16.7 | 20.5 | 0.58† |
| Hodgkin lymphomas | 3.0 | 2.3 | 1.30† | 3.3 | 2.6 | 2.9 | 3.2 | 2.4 | 2.7 | 0.94† | 2.7 | 1.9 | 2.3 | 0.79† | 1.4 | 0.9 | 1.2 | 0.40† |
| Classical Hodgkin lymphoma, Nodular sclerosis | 1.4 | 1.4 | 1.01 | 1.6 | 1.6 | 1.6 | 1.1 | 1.2 | 1.2 | 0.71† | 1.1 | 0.9 | 1.0 | 0.60† | 0.6 | 0.5 | 0.6 | 0.36† |
| Classical Hodgkin lymphoma, Mixed cellularity/lymphocyte depleted | 0.4 | 0.2 | 2.04† | 0.4 | 0.2 | 0.3 | 0.5 | 0.2 | 0.4 | 1.15† | 0.5 | 0.3 | 0.4 | 1.19† | 0.2 | 0.1 | 0.1 | 0.42† |
| Classical Hodgkin lymphoma, NOS | 0.9 | 0.6 | 1.48† | 0.8 | 0.6 | 0.7 | 1.0 | 0.6 | 0.8 | 1.08 | 0.9 | 0.6 | 0.8 | 1.09 | 0.4 | 0.3 | 0.3 | 0.49† |
| Nodular lymphocyte predominant | 0.2 | 0.1 | 2.20† | 0.3 | 0.1 | 0.2 | 0.3 | 0.3 | 0.3 | 1.97† | 0.1 | 0.1 | 0.1 | 0.61† | 0.1 | <0.1 | 0.1 | 0.32† |
| B-cell non-Hodgkin lymphoid neoplasms, total | 38.8 | 25.8 | 1.52† | 36.8 | 23.7 | 29.6 | 33.3 | 23.7 | 27.7 | 0.93† | 29.6 | 21.6 | 25.1 | 0.85† | 21.1 | 14.1 | 17.2 | 0.58† |
| Precursor B-cell lymphoblastic leukemia/lymphoma | 1.5 | 1.3 | 1.18† | 1.4 | 1.2 | 1.3 | 0.8 | 0.7 | 0.7 | 0.56† | 2.1 | 1.9 | 2.0 | 1.50† | 1.3 | 1.1 | 1.2 | 0.88† |
| Chronic lymphocytic leukemia/small lymphocytic lymphoma | 6.9 | 3.7 | 1.88† | 7.5 | 4.0 | 5.6 | 5.2 | 3.0 | 3.9 | 0.71† | 3.1 | 1.8 | 2.4 | 0.42† | 2.0 | 0.9 | 1.4 | 0.25† |
| Mantle cell lymphoma | 1.3 | 0.4 | 3.07† | 1.4 | 0.5 | 0.9 | 0.6 | 0.2 | 0.3 | 0.36† | 1.0 | 0.3 | 0.6 | 0.70† | 0.4 | 0.2 | 0.3 | 0.34† |
| Lymphoplasmacytic lymphoma (including WM) | 0.8 | 0.4 | 1.79† | 0.8 | 0.5 | 0.6 | 0.5 | 0.3 | 0.4 | 0.57† | 0.3 | 0.3 | 0.3 | 0.45† | 0.4 | 0.2 | 0.3 | 0.49† |
| Diffuse large B-cell lymphoma | 8.4 | 5.6 | 1.49† | 8.7 | 5.8 | 7.1 | 6.0 | 3.8 | 4.8 | 0.67† | 7.9 | 6.0 | 6.8 | 0.97† | 7.0 | 5.0 | 5.9 | 0.83† |
| Burkitt lymphoma/leukemia | 0.6 | 0.2 | 2.79† | 0.6 | 0.2 | 0.4 | 0.5 | 0.2 | 0.3 | 0.81† | 0.5 | 0.3 | 0.4 | 1.02 | 0.6 | 0.2 | 0.4 | 0.92 |
| Marginal zone lymphoma | 1.9 | 1.8 | 1.05† | 2.0 | 1.9 | 1.9 | 1.5 | 1.4 | 1.4 | 0.75† | 1.5 | 1.6 | 1.5 | 0.81† | 1.4 | 1.3 | 1.3 | 0.69† |
| Follicular lymphoma | 3.7 | 3.2 | 1.18† | 4.1 | 3.5 | 3.8 | 1.6 | 1.5 | 1.5 | 0.41† | 2.8 | 2.8 | 2.8 | 0.73† | 2.0 | 1.4 | 1.7 | 0.44† |
| Hairy cell leukemia including variant | 0.7 | 0.3 | 2.77† | 0.8 | 0.3 | 0.5 | 0.4 | 0.1 | 0.3 | 0.49† | 0.5 | 0.2 | 0.3 | 0.56† | 0.3 | 0.2 | 0.2 | 0.45† |
| Plasma cell neoplasms | 7.8 | 5.1 | 1.53† | 7.1 | 4.3 | 5.6 | 14.6 | 11.3 | 12.6 | 2.26† | 7.8 | 5.1 | 6.3 | 1.12† | 4.4 | 2.8 | 3.5 | 0.63† |
| T/NK-cell lymphoid neoplasms, total | 2.7 | 1.6 | 1.63† | 2.6 | 1.5 | 2.0 | 3.5 | 2.5 | 2.9 | 1.49† | 2.3 | 1.5 | 1.8 | 0.93† | 2.3 | 1.3 | 1.8 | 0.89† |
| Precursor T/NK-cell lymphoblastic leukemia/lymphoma | 0.4 | 0.2 | 2.13† | 0.4 | 0.2 | 0.3 | 0.5 | 0.3 | 0.4 | 1.33† | 0.3 | 0.2 | 0.2 | 0.78† | 0.4 | 0.2 | 0.3 | 0.93 |
| Mycosis fungoides | 0.5 | 0.3 | 1.52† | 0.5 | 0.3 | 0.3 | 0.6 | 0.6 | 0.6 | 1.78† | 0.4 | 0.3 | 0.3 | 0.89 | 0.3 | 0.2 | 0.3 | 0.73† |
| Peripheral T-cell lymphomas | 1.2 | 0.8 | 1.61† | 1.2 | 0.7 | 0.9 | 1.7 | 1.2 | 1.4 | 1.49† | 1.1 | 0.7 | 0.9 | 0.93 | 1.1 | 0.6 | 0.8 | 0.89 |
- IRR indicates incidence rate ratios; NOS, not otherwise specified; WM, Waldenstrom macroglobulinemia.
- *Rates are per 100,000 and age adjusted to the US standard population.
- †Incidence rate ratio is significantly different from 1.00, p<0.05.
- Source: North American Association of Central Cancer Registries, Cancer in North America (CiNA) analytic file.14
Race
Table 2 also provides incidence rates for selected lymphoma subtypes for 4 major racial/ethnic groups. Non-Hispanic whites have the highest overall lymphoma incidence rate. Compared with non-Hispanic whites, overall lymphoma incidence rates were slightly (4%) lower among non-Hispanic blacks, 14% lower among Hispanics, and 42% lower among Asians/Pacific Islanders; however, there was considerable variation by subtype (Table 2). Burkitt lymphoma is of interest, because a subtype of this cancer (called endemic Burkitt lymphoma) was first diagnosed in African children in the late 1950s6 and is the most common childhood malignancy in equatorial Africa. However in the United States, Burkitt lymphoma is slightly less common in blacks than in other race groups (Table 2). In general, incidence rates for most B-cell lymphomas were 19% to 64% lower among blacks than among whites, but plasma cell neoplasm rates were the opposite. Plasma cell neoplasms were twice as common in black individuals compared with white individuals (IRR, 2.26) and Asians/Pacific Islanders had the lowest risk (IRR, 0.63). In part, obesity may explain these differences, because non-Hispanic blacks have the highest age-adjusted rates of obesity (47.8%), followed by non-Hispanic whites (32.6%), and then Asians (10.8%).55 There is also research suggesting that other differences between non-Hispanic blacks and non-Hispanic whites may play a role in the disparity in myeloma incidence, including genetic factors (specifically for human leukocyte antigens) and a differential response to immune challenges.56 T-cell lymphomas are also more common among black individuals compared with white individuals, ranging from an IRR of 1.49 for peripheral T-cell lymphoma to an IRR of 1.78 for mycosis fungoides. Specific subtypes of peripheral T-cell lymphoma are more common in Asia than in Western countries (adult T-cell leukemia/lymphoma and extranodal NK/T-cell lymphoma/leukemia), and a recent report found that these subtypes are also more common in US Asian/Pacific populations;9 although, overall rates of peripheral T-cell lymphoma are slightly higher among non-Hispanic whites, as seen in Table 2.
Compared with non-Hispanic whites, Hispanics had lower incidence rates for most lymphoma subtypes; however, Hispanics had the highest incidence rates for precursor B-cell lymphoblastic leukemia/lymphoma, which occurs primarily in children. Higher rates of this cancer in Hispanics have been previously observed in studies of pediatric cancers in the United States57 and in other countries.58, 59 Future studies are needed to assess the relative contribution of genetic and environmental factors, including infections, to this disparity. Asians/Pacific Islanders had the lowest incidence rates for most lymphoma subtypes, with the exception of the rare subtypes of peripheral T-cell lymphoma noted previously.
Temporal Trends in Incidence
Recent trends in incidence rates for the major lymphoid neoplasm subtypes by sex are summarized in Table 3. Overall lymphoma incidence rates have declined slightly (0.3% per year) since 2001 in females and since 2004 in males (Table 3). Previously, lymphoma incidence rates increased steadily during the 1970s and 1980s, leveled off in the 1990s, and began a slight decline by the end of the decade.60 This drop has been attributed to a decrease in AIDS incidence,61 but a closer look by Shiels et al12 showed that this decline was independent of HIV and may in part reflect coding changes in 2001, when the WHO classification system was first published.
| JOINPOINT TREND 1* | JOINPOINT TREND 2* | JOINPOINT TREND 3* | ||||
|---|---|---|---|---|---|---|
| YEARS | APC | YEARS | APC | YEARS | APC | |
| All lymphoid neoplasms | ||||||
| Males | 2001-2004 | 0.5 | 2004-2012 | −0.3† | ||
| Females | 2001-2012 | −0.3† | ||||
| Hodgkin lymphomas | ||||||
| Overall Hodgkin lymphoma | ||||||
| Males | 2001-2008 | 0.2 | 2008-2012 | −1.6† | ||
| Females | 2001-2012 | −0.6† | ||||
| Classical Hodgkin lymphoma, nodular sclerosis | ||||||
| Males | 2001-2010 | −1.3† | 2010-2012 | −7.2 | ||
| Females | 2001-2012 | −1.9† | ||||
| Classical Hodgkin lymphoma, mixed cellularity/lymphocyte depleted | ||||||
| Males | 2001-2007 | −3.5† | 2007-2012 | −0.7 | ||
| Females | 2001-2012 | −2.5† | ||||
| Classical Hodgkin lymphoma, NOS | ||||||
| Males | 2001-2012 | 2.6† | ||||
| Females | 2001-2005 | 7.4† | 2005-2012 | 1.2 | ||
| Nodular lymphocyte predominant Hodgkin lymphoma | ||||||
| Males | 2001-2012 | 6.4† | ||||
| Females | 2001-2012 | 7.8† | ||||
| Precursor B-cell and T-cell lymphomas | ||||||
| Precursor B-cell lymphoblastic leukemia/lymphoma | ||||||
| Males | 2001-2006 | 6.1† | 2006-2012 | 2.6† | ||
| Females | 2001-2012 | 4.5† | ||||
| Precursor T/NK-cell lymphoblastic leukemia/lymphoma | ||||||
| Males | 2001-2012 | 2.8† | ||||
| Females | 2001-2012 | 4.9† | ||||
| Mature B-cell non-Hodgkin lymphomas | ||||||
| Chronic lymphocytic leukemia/small lymphocytic lymphoma | ||||||
| Males | 2001-2005 | 0.4 | 2005-2012 | −2.7† | ||
| Females | 2001-2005 | 0.7 | 2005-2012 | −2.9† | ||
| Mantle cell lymphoma | ||||||
| Males | 2001-2012 | 1.4† | ||||
| Females | 2001-2012 | 0.7 | ||||
| Lymphoplasmacytic lymphoma (including WM) | ||||||
| Males | 2001-2012 | −1.4† | ||||
| Females | 2001-2012 | −1.2† | ||||
| Diffuse large B-cell lymphoma | ||||||
| Males | 2001-2012 | 0.1 | ||||
| Females | 2001-2012 | −0.3 | ||||
| Burkitt lymphoma/leukemia | ||||||
| Males | 2001-2012 | 0.4 | ||||
| Females | 2001-2004 | −2.0 | 2004-2009 | 1.5† | 2009-2012 | −2.6† |
| Marginal zone lymphomas | ||||||
| Males | 2001-2003 | 10.1 | 2003-2012 | 1.4† | ||
| Females | 2001-2003 | 6.5 | 2003-2009 | 1.8† | 2009-2012 | −0.6 |
| Follicular lymphoma | ||||||
| Males | 2001-2004 | 4.7† | 2004-2012 | −2.2† | ||
| Females | 2001-2004 | 3.4† | 2004-2007 | −0.8 | 2007-2012 | −3.6† |
| Hairy cell leukemia including variant | ||||||
| Males | 2001-2012 | 1.7† | ||||
| Females | 2001-2012 | 2.6† | ||||
| Plasma cell neoplasms | ||||||
| Males | 2001-2008 | 0.0 | 2008-2012 | 2.6† | ||
| Females | 2001-2007 | −0.3 | 2007-2012 | 2.3† | ||
| B-cell lymphoid neoplasms, NOS | ||||||
| Males | 2001-2007 | −1.7 | 2007-2012 | 4.6† | ||
| Females | 2001-2007 | −2.5† | 2007-2010 | 6.4 | 2010-2012 | −1.8 |
| Mature T/NK-cell non-Hodgkin lymphoid neoplasms | ||||||
| Mycosis fungoides | ||||||
| Males | 2001-2012 | 1.7† | ||||
| Females | 2001-2012 | 2.1† | ||||
| Peripheral T-cell lymphoma | ||||||
| Males | 2001-2012 | −1.1† | ||||
| Females | 2001-2012 | −0.7 | ||||
- APC indicates annual percent change; NOS, not otherwise specified; WM, Waldenstrom macroglobulinemia.
- *Each change in magnitude and/or direction of trend is listed separately with the years for which that trend was constant. Therefore if only one trend is listed for 2001 through 2012, the trend was constant during the entire time period.
- †The annual percent change is significantly different from zero.
- Source: North American Association of Central Cancer Registries, Cancer in North America (CiNA) analytic file.14
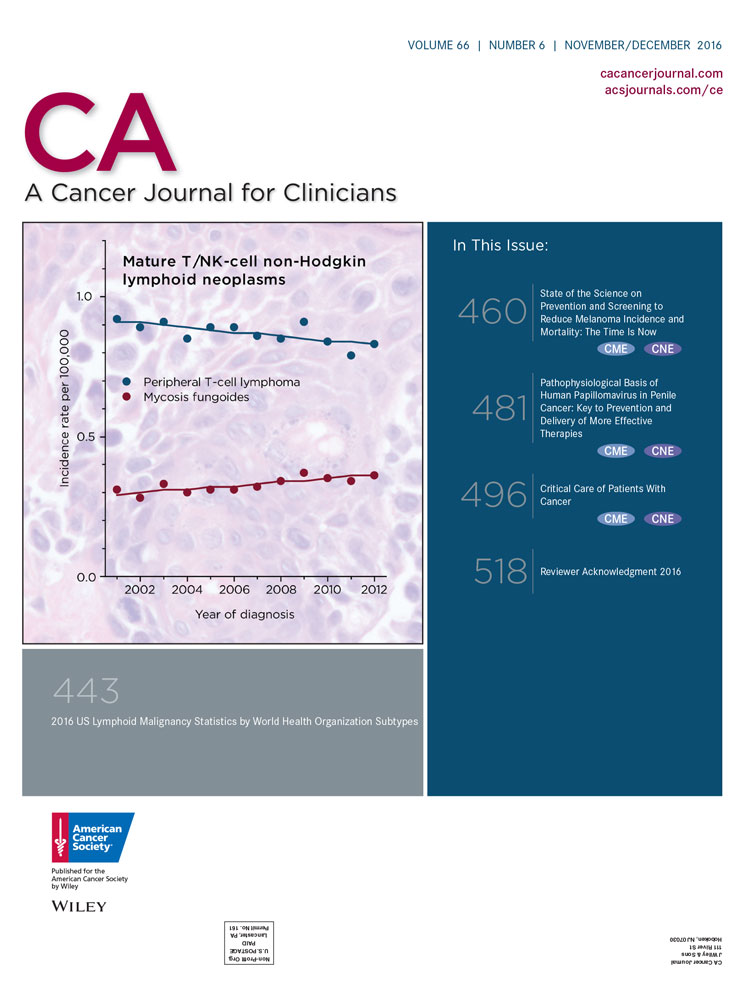
Trends for specific lymphoid neoplasm subtypes over the 12-year period from 2001 through 2012 are described in Table 3 and shown in Figure 3. Precursor lymphoid neoplasm incidence rates increased from 2001 to 2012, particularly for B-cell neoplasms. Reasons for the continued, sharp increase in precursor B-cell lymphoblastic leukemia/lymphoma are not known, but changes in some environmental factors or improved treatment for conditions that were previously fatal for children have been suggested. Among mature lymphoid neoplasms, the fastest increase was for plasma cell neoplasms. Trends in increasing body size in part may explain this increase, because obesity was steadily increasing over this time period55 and is a risk factor for plasma cell neoplasms.62
Declines were noted for several subtypes, including follicular lymphoma, peripheral T-cell lymphoma, and chronic lymphocytic leukemia/small lymphocytic lymphoma. Some changes, like the decrease for chronic lymphocytic leukemia/small lymphocytic lymphoma, likely reflect a change in the diagnostic criteria in 2008.63, 64 Classification changes and improved diagnostic tools have also been suggested as the explanation for increases in both marginal zone lymphoma and mantle cell lymphoma.11 For marginal zone lymphoma, large, but nonsignificant, rate increases were seen in both sexes from 2000 to 2003, followed by more moderate rate increases. In analyses of trends by HIV status, Shiels et al12 found that excluding HIV-infected patients with NHL did not impact the observed trends for this subtype, and it is possible that the initial increase in incidence for marginal zone lymphoma reflects ICD-O coding changes for this cancer subtype. Rates of mantle cell lymphoma, however, have been increasing since 2001, which may reflect a true increase in incidence. Declines in incidence rates of follicular lymphoma and peripheral T-cell lymphoma may reflect declines in smoking rates65 over this time period, as a positive association with these 2 lymphoid neoplasm subtypes has been noted despite a lack of association with NHL overall.3, 47, 66-68

Incidence Rate Trends for Select Lymphoid Neoplasm Subtypes: United States, 2001 to 2012.
HL indicates Hodgkin lymphoma; NOS, not otherwise specified, T/NK-cell, T-cell/natural killer cell.Source: North American Association of Central Cancer Registries, Cancer in North America (CiNA) analytic file.14
Relative Survival by Race and Sex
The 2-year, 5-year, and 10-year relative survival for patients by lymphoid neoplasm subtype and race are illustrated in Figures 4 through 7. There is tremendous variability in prognosis by subtype. Mature T-cell lymphomas (Fig. 4) are particularly interesting, because peripheral T-cell lymphoma and mycosis fungoides are at opposite extremes in terms of survival—peripheral T-cell lymphoma was among the subtypes with the worst survival (36%-56% 5-year survival, depending on race/sex), while mycosis fungoides was among those with the best survival (79%-92% 5-year survival). Five-year survival for patients with mature B-cell lymphomas ranged from 83% to 91% for marginal zone lymphoma and from 78% to 92% for hairy cell leukemia to as low as 47% to 63% for Burkitt lymphoma and 44% to 48% for plasma cell neoplasms (Fig. 5). Notably, 2-year survival was approximately 70% for patients with plasma cell neoplasms of all race groups. Although the observed difference between 2-year, 5-year, and 10-year survival for plasma cell neoplams partly reflects short-term versus long-term survival, it also may reflect in part the many new therapies that have emerged in recent years.69 Two-year survival was quite high for other lymphoid neoplasm subtypes, like marginal zone lymphoma (range, 89%-95%) and follicular lymphoma (range, 88%-93%), but hovered around one-half to two-thirds for Burkitt lymphoma, 49%-68% and diffuse large B-cell lymphoma, 63-68%.

Relative 2-Year, 5-Year, and 10-Year Survival for Select Mature T-Cell/Natural Killer Cell Non-Hodgkin Lymphoid Neoplasm Subtypes by Sex and Race.
Error bars represent 95% confidence intervals. For 2-year survival rates, included patients were diagnosed between 2007 and 2011; for 5-year survival, patients were diagnosed between 2005 and 2011; and for 10-year survival, patients were diagnosed between 2001 and 2011. All patients were followed through 2012.Source: National Cancer Institute; Surveillance, Epidemiology, and End Results (SEER) program; 18 SEER Registries.
16
Relative 2-Year, 5-Year, and 10-Year Survival for Select Mature B-Cell Non-Hodgkin Lymphoid Neoplasm Subtypes by Sex and Race.
Error bars represent 95% confidence intervals. For 2-year survival rates, included patients were diagnosed between 2007 and 2011; for 5-year survival, patients were diagnosed between 2005 and 2011; and for 10-year survival, patients were diagnosed between 2001 and 2011. All patients were followed through 2012.Source: National Cancer Institute; Surveillance, Epidemiology, and End Results (SEER) program; 18 SEER Registries.16

Relative 2-Year, 5-Year, and 10-Year Survival for Precursor B-Cell and T-Cell Non-Hodgkin Lymphoid Neoplasms by Sex and Race.
Error bars represent 95% confidence intervals. For 2-year survival rates, included patients were diagnosed between 2007 and 2011; for 5-year survival, patients were diagnosed between 2005 and 2011; and for 10-year survival, patients were diagnosed between 2001 and 2011. All patients were followed through 2012.Source: National Cancer Institute; Surveillance, Epidemiology, and End Results (SEER) program; 18 SEER Registries.16

Relative 2-Year, 5-Year, and 10-Year Survival for Select Hodgkin Lymphoma Subtypes by Sex and Race.
HL indicates Hodgkin lymphoma. Bars represent 95% confidence intervals. For 2-year survival rates, the included patients were diagnosed between 2007 and 2011; for 5-year survival, patients were diagnosed between 2005 and 2011; and for 10-year survival, patients were diagnosed between 2001 and 2011. All patients were followed through 2012. NOS indicates not otherwise specified.Source: National Cancer Institute; Surveillance, Epidemiology, and End Results (SEER) program; 18 SEER Registries.16
Blacks (particularly males) had lower survival than whites for many lymphoid neoplasm subtypes. For example, survival for Hodgkin lymphoma (Fig. 7) was lower for black males than for any other race/sex group. Patients who had classical Hodgkin lymphoma, NOS, had the lowest survival of any Hodgkin lymphoma subtype examined, particularly for black men (77% 2-year survival, 69% 5-year survival, 55% 10-year survival).
Other subtypes with notable survival differences by race include mycosis fungoides, peripheral T-cell lymphoma, Burkitt lymphoma, and chronic lymphocytic leukemia/small lymphocytic lymphoma. Among the T-cell lymphomas, peripheral T-cell lymphoma survival was poor for all race/sex groups, but particularly for black men and women, even at 2 years postdiagnosis (Fig. 4). In contrast, mycosis fungoides survival was generally much higher, but both 5-year and 10-year survival were lowest among black men and women (Fig. 4). Unlike some other lymphoid neoplasm subtypes, rates of mycosis fungoides are increasing, so the observed disparities may become an even larger problem over time. At the extreme, 100071"/> study in which no race differences were observed in myeloma survival even when stage and other prognostic factors were taken into account. Furthermore, a study of patient data from 21 comprehensive cancer centers56 reported no race differences in myeloma treatment regimen but found that the risk of death was actually greater for whites than for blacks.
Limitations
Although the number of expected cases in 2016 provides a reasonably accurate portrayal of the contemporary cancer burden of lymphoid neoplasms, the data on specific subtypes should be interpreted with caution. Some WHO lymphoid neoplasm subtypes are extremely rare, making estimation of rates and expected cases less robust. Because lymphoid malignancies are extremely complex and heterogeneous, there have been many coding changes for these cancers over time, and these changes may impact trends for some subtypes (as discussed above). Furthermore, despite the detailed categorization developed by the WHO, there also are non-negligible numbers of lymphoid malignancies recorded in cancer registries as unclassified, either overall or within subtypes (eg, classic Hodgkin lymphoma, NOS). Not only are these heterogeneous, unclassified lymphomas difficult to study, but the defined subtypes to which these cases truly belong are underestimated. For some lymphoid malignancies, these cases comprise a substantial proportion of total cases and could distort the incidence and survival of classified cases.
Conclusions
This report presents the latest available incidence and survival statistics for lymphoid neoplasm subtypes separately by age, sex, and race. This is the first time that there have been projected case estimates for lymphoid neoplasm subtypes, including rare lymphomas and a detailed, comprehensive look at survival by WHO lymphoid neoplasm subtypes. It is clear that there are stark differences in incidence and survival patterns by subtype that vary sometimes by sex and often by race. Most types of lymphoid neoplasms are more common in men, but nodular sclerosis classical Hodgkin lymphoma and some types of NHL are approximately equally common in women. Non-Hispanic whites have higher incidence rates of most types of lymphoid neoplasms, although plasma cell neoplasms and T-cell lymphomas are twice as common in non-Hispanic blacks. Although incidence rates of lymphoid neoplasms are generally higher among whites, black men tend to have poorer survival. These differences are not explained by our current, limited understanding of the etiology of these cancers, and future research into the reasons for these disparities is needed. These data underscore the importance of taking into account differences in lymphoid neoplasm subtypes when developing management strategies for these cancers and may also offer clues about their etiology.
Author Contributions
Lauren R. Teras: Conceptualization, methodology, writing–original draft, visualization, supervision, and project administration. Carol E. DeSantis: Conceptualization, methodology, formal analysis, investigation, data curation, writing–review and editing, and visualization. James R. Cerhan: Conceptualization and writing–review and editing. Lindsay M. Morton: Methodology and writing–review and editing. Ahmedin Jemal: Conceptualization and writing–review and editing. Christopher R. Flowers: Conceptualization, methodology, validation, writing–original draft, writing–review and editing, supervision, and project administration.